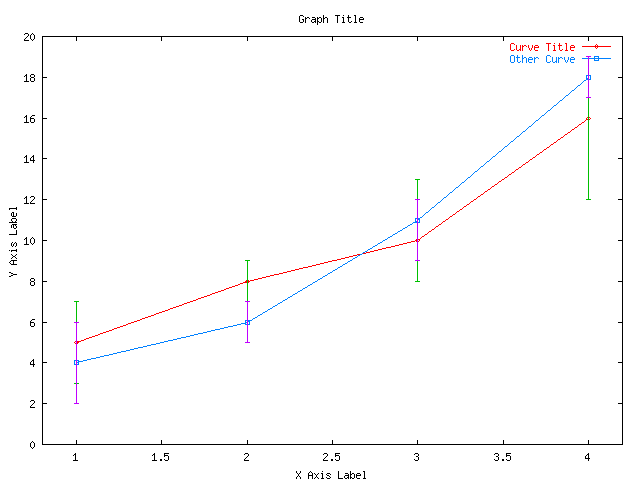
Consider the following example data file ("data") where the first, second, third, and fourth columns hold the x, y, min x, and max x values, respectively:
1 5 3 7 4
2 8 5 9 6
3 10 8 13 11
4 16 12 19 18
You can plot this with following gnuplot command script:
set title "Graph Title"
set xlabel "X Axis Label"
set ylabel "Y Axis Label"
set term gif
set output "2D.gif"
# To make postscript do
# set term postscript eps
# set output "2D.eps"
set data style lp
plot [.8:4.2] "2D.data" using 1:2 t "Curve Title", "2D.data" using
1:2:3:4 notitle with errorbars lt 1 ps 0, "2D.data" using 1:5 t "Other
Curve", "2D.data" using 1:5:6:7 notitle with errorbars lt 1 ps 0
This generates a gif file called "2D.gif" which looks like:

Note your could set the term to other types such as "postscript eps".