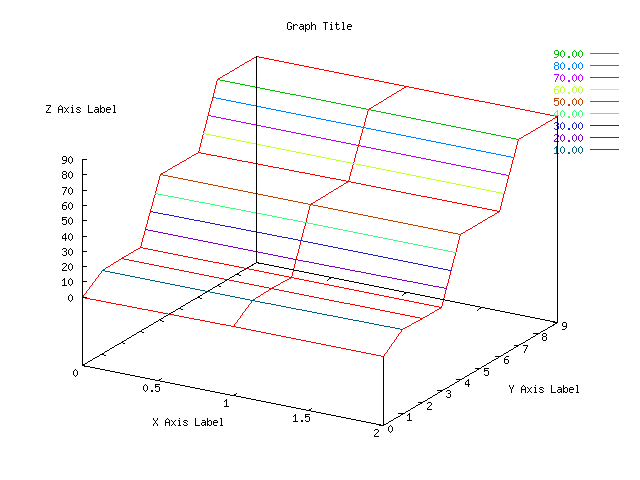
Consider the following example data file ("3D.data") where the first, second, and third columns hold the y, x, z values, respectively:
0 0 0
0 1 0
0 2 0

1 0 10
1 1 10
1 2 10

2 0 10
2 1 10
2 2 10

3 0 10
3 1 10
3 2 10

4 0 50
4 1 50
4 2 50

6 0 50
6 1 50
6 2 50

7 0 90
7 1 90
7 2 90

9 0 90
9 1 90
9 2 90
This data file is organized as "grid" data. The x-values (2nd column) vary faster than the y-values (1st column). The data is grouped by y-values with a newline separating the y-values. You can plot this with following gnuplot command script:
set data style lines
set surface
set contour surface

set view 60, 30, 1, 1
set clabel '%8.2f'
set key right
set title "Graph Title"
set xlabel "X Axis Label"
set ylabel "Y Axis Label"
set zlabel "Z Axis Label"

set term gif
set output "3D.gif"
splot "3D.data" using 2:1:3 notitle
This generates a gif file called "3D.gif" which looks like:

Note your could set the term to other types such as "postscript eps enhanced". You can use greek symbols by doing
set xlabel "{/Symbol=14 \167}"
This will set the xlabel to the greek symbol omega. This only works for
postscript eps enhanced. To use another greek symbol, change the \167
to the number of the symbol you want (e.g., \144 is lower-case delta).